Intro to Key Concepts and Ideas
Question: What is climate change?
Answer: Climate change refers to a long-term shift in global or regional weather patterns.
Weather and climate are not the same.
- Weather refers to atmospheric conditions that occur locally over short periods of time – from minutes to hours or days (e.g. rain, snow, clouds, winds, floods, or thunderstorms.)
- Climate refers to the long-term regional or even global average of temperature, humidity, and rainfall patterns over seasons, years, or decades. [1]
Question: What is global warming?
Answer: Global warming refers to the long-term trend of rising average global temperatures, commonly defined as the increase in the 30-year global average of combined air temperature over land and water temperature at the ocean surface. [2]
Question: How are climate change and global warming related?
Answer: Global warming refers specifically to the long-term trend of rising average global temperatures, while climate change refers to a broader set of changes in global or regional climate patterns that result from the Earth’s warming. Therefore, global warming not only influences climate change, but it is one of its main drivers.
Question: How can global warming be measured?
Answer: The primary metric for measuring global warming is the Earth energy imbalance (EEI), which is how much of the sun’s energy the Earth absorbs and how much energy the Earth emits back into space as thermal infrared radiation. [3]
- An increasing Earth energy imbalance causes additional heating of the planet, manifesting in numerous ways, including a rise in the global mean surface temperature (GMST). [4]
- The Earth energy imbalance is rising at an alarming rate, having doubled over the past 20 years. [3]
Question: What causes global warming?
Answer: Compared to other non-human factors, such as volcanic activity and solar irradiance, the concentration of carbon dioxide (CO2) and other greenhouse gases (GHGs) in the atmosphere have the greatest overall impact on the EEI. [5] [6]
Question: How do we know humans are responsible for the atmospheric CO2 causing global warming?
Answer: Due to the isotopic fingerprint of the carbon present in the atmosphere today, we can be sure that the rising concentration of CO2 is the result of human activity and not natural phenomena. [7]
Question: What explains the climate system variability of the past before human activity?
Answer: The climate system variability of the past, including ice ages and shifting climate, were primarily caused by natural factors such as changes in solar output, Earth’s orbit, ocean circulation, and the reflectivity of the Earth’s surface (albedo). Additionally, the makeup of the atmosphere, including the levels of carbon dioxide and other greenhouse gases such as water vapor, methane, nitrous oxide, and ozone, played a significant role in shaping the climate over long periods of time.
With Key Concepts and Ideas defined, let’s look at some numbers.
- In 2020, U.S. greenhouse gas emissions totaled 5,222 million metric tons of carbon dioxide equivalents (MMTCO2e) after accounting for sequestration from the land sector. [8]
- The unit “CO2e” represents an amount of a GHG whose atmospheric impact has been standardized to that of one unit mass of carbon dioxide (CO2), based on the global warming potential (GWP) of the gas.
- Thus, the equation for calculating CO2e is:

Where,
CO2e = carbon dioxide equivalent, metric tons/year
GHGi = mass emissions of each greenhouse gas, metric tons/year
GWPi = global warming potential for each greenhouse gas
n = the number of greenhouse gases emitted
- Therefore, 2020 U.S. greenhouse gas emissions equate to the global warming potential of approximately 132 Salesforce Towers filled to the brim with crude oil getting torched every day. [9]

- And this is just the United States, China and India are burning 356 and 62 Salesforce Tower-equivalents of crude oil on a daily basis, respectively.
- PPM (parts per million) is a common unit of measurement for describing the relative abundance of a substance in a mixture.
- PPM can be expressed as unitless fraction, such as:
PPM = (# of molecule X / total # of molecules in the mixture) x 106
- PPMV (parts per million by volume), on the other hand, is defined as the number of parts of a gas per million parts of the volume of the mixture. This value is used to express the concentration of a gas in a gaseous mixture, such as the amount of CO2 in the atmosphere.
PPMV = (volume of gas / total volume of the mixture) x 106
- To calculate the atmospheric concentration of CO2 in ppmv, the total amount of CO2 in the atmosphere (in grams) is divided by the total amount of air in the atmosphere (in cubic meters) and multiplied by a conversion factor to express the result in parts per million by volume. The conversion factor used is 1,000,000 parts per million divided by the total number of parts per million of all gases in the atmosphere (excluding water vapor), which is approximately 2.13 x 10⁵ ppmv.
CO2 ppmv = (mass of atmospheric CO2 / volume of atmosphere) x (1,000,000 / 2.13 x 10⁵ ppmv)
Example:
- As of September 2021, the total mass of CO2 in the atmosphere is about 3.3 trillion metric tons.
- Assuming a constant density of air throughout the atmosphere, such as the density of air at sea level (1.225 kg/m3), and an estimate of the average total mass is about 5.137 x 10¹⁸ kg we can calculate the total volume of air as follows [10]:
CO2 ppmv (2021) = (3.3 x 10¹⁵ kg CO2 / (5.137 x 10¹⁸ kg / 1.225 kg/m3)) x (1,000,000 / 2.13 x 10⁵ ppmv) = 415.39 CO2 ppmv
Now let’s add some historical context to our numbers.
- Since the beginning of the industrial revolution (approximately 1750 A.D.) the world has emitted over 1.6 trillion tonnes of CO2 (1,600 gigatonnes “GtCO2”), causing the annual concentration of atmospheric CO2 to increase nearly 50% to 412.5 parts per million (ppm) over that period. [11,12]
- During all of the cycles between ice ages and warm periods over the past million years, atmospheric carbon dioxide never climbed higher than 300 parts per million. [5]
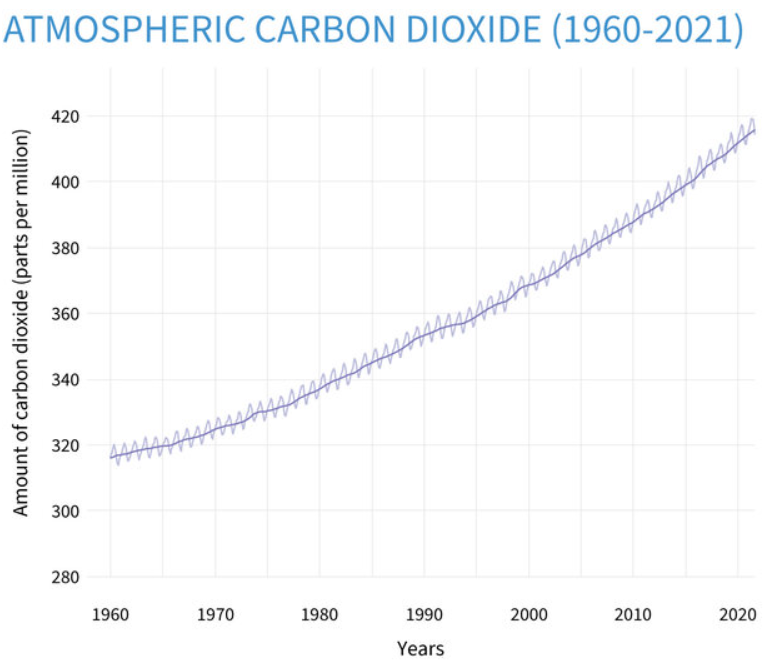
- Over the last 60 years, the annual growth rate in the concentration of atmospheric CO2 has tripled, reaching 2.4 ppm per year during the 2010s. [13]
- The 445 gigatonnes of carbon (GtC, not GtCO2) released into the atmosphere over roughly the past 250 years is greater than the 400 Gt of carbon estimated to be currently stored in all the world’s forests. [14]
[SOURCES]
Intro to Key Concepts and Ideas
[1] Global Warming vs. Climate Change
https://climate.nasa.gov/global-warming-vs-climate-change/
[2] Special Report: Global Warming of 1.5 ºCCH – Framing and Context
https://www.ipcc.ch/sr15/chapter/chapter-1/
[3] Joint NASA, NOAA Study Finds Earth’s Energy Imbalance Has Doubled (2021)
https://www.nasa.gov/feature/langley/joint-nasa-noaa-study-finds-earths-energy-imbalance-has-doubled
[4] A perspective on climate change from Earth’s energy imbalance (2022)
https://iopscience.iop.org/article/10.1088/2752-5295/ac6f74
[5] Is the Sun causing global warming?
https://climate.nasa.gov/faq/14/is-the-sun-causing-global-warming/
[6] On the causal structure between CO2 and global temperature (2016) https://www.nature.com/articles/srep21691
[7] How do we know the build-up of carbon dioxide in the atmosphere is caused by humans?
With Key Concepts and Ideas defined, let’s look at some numbers.
[8] Inventory of U.S. Greenhouse Gas Emissions and Sinks https://www.epa.gov/ghgemissions/inventory-us-greenhouse-gas-emissions-and-sinks
[9] Greenhouse Gas Equivalencies Calculator
https://www.epa.gov/energy/greenhouse-gas-equivalencies-calculator
5,222 MMTCO2e = 12.1B barrels of crude oil = 67.9B sq. ft. / 1.4M sq ft. = 48,500 Salesforce Towers (SFT) / 365 days = 132.8 SFTs / day
[10] Carbon Dioxide Information Analysis Center – Conversion Tables
https://web.archive.org/web/20170118004650/http://cdiac.ornl.gov/pns/convert.html
Now let’s add some historical context to our numbers.
[11] Global Carbon Budget 2022 (2022)
https://essd.copernicus.org/articles/14/4811/2022/
[12] CO2 emissions
https://www.iea.org/reports/global-energy-review-2021/co2-emissions
[13] Climate Change: Atmospheric Carbon Dioxide
[14] Global Carbon